Skip to content
Closing levels · 27 Oct 2026S&P 500 7,722.60Nasdaq-100 29,651.44Dow Jones 52,377.57Nifty 50 22,749.75Sensex 73,598.67USD / INR 95.11Gold $4,074.60Brent $113.88Kio Growth · On the Artha Bharat platform
01Thesis

Three sectors,
one decade.

Three sectors where we expect the fastest earnings growth this decade, led by companies listed in US dollars.

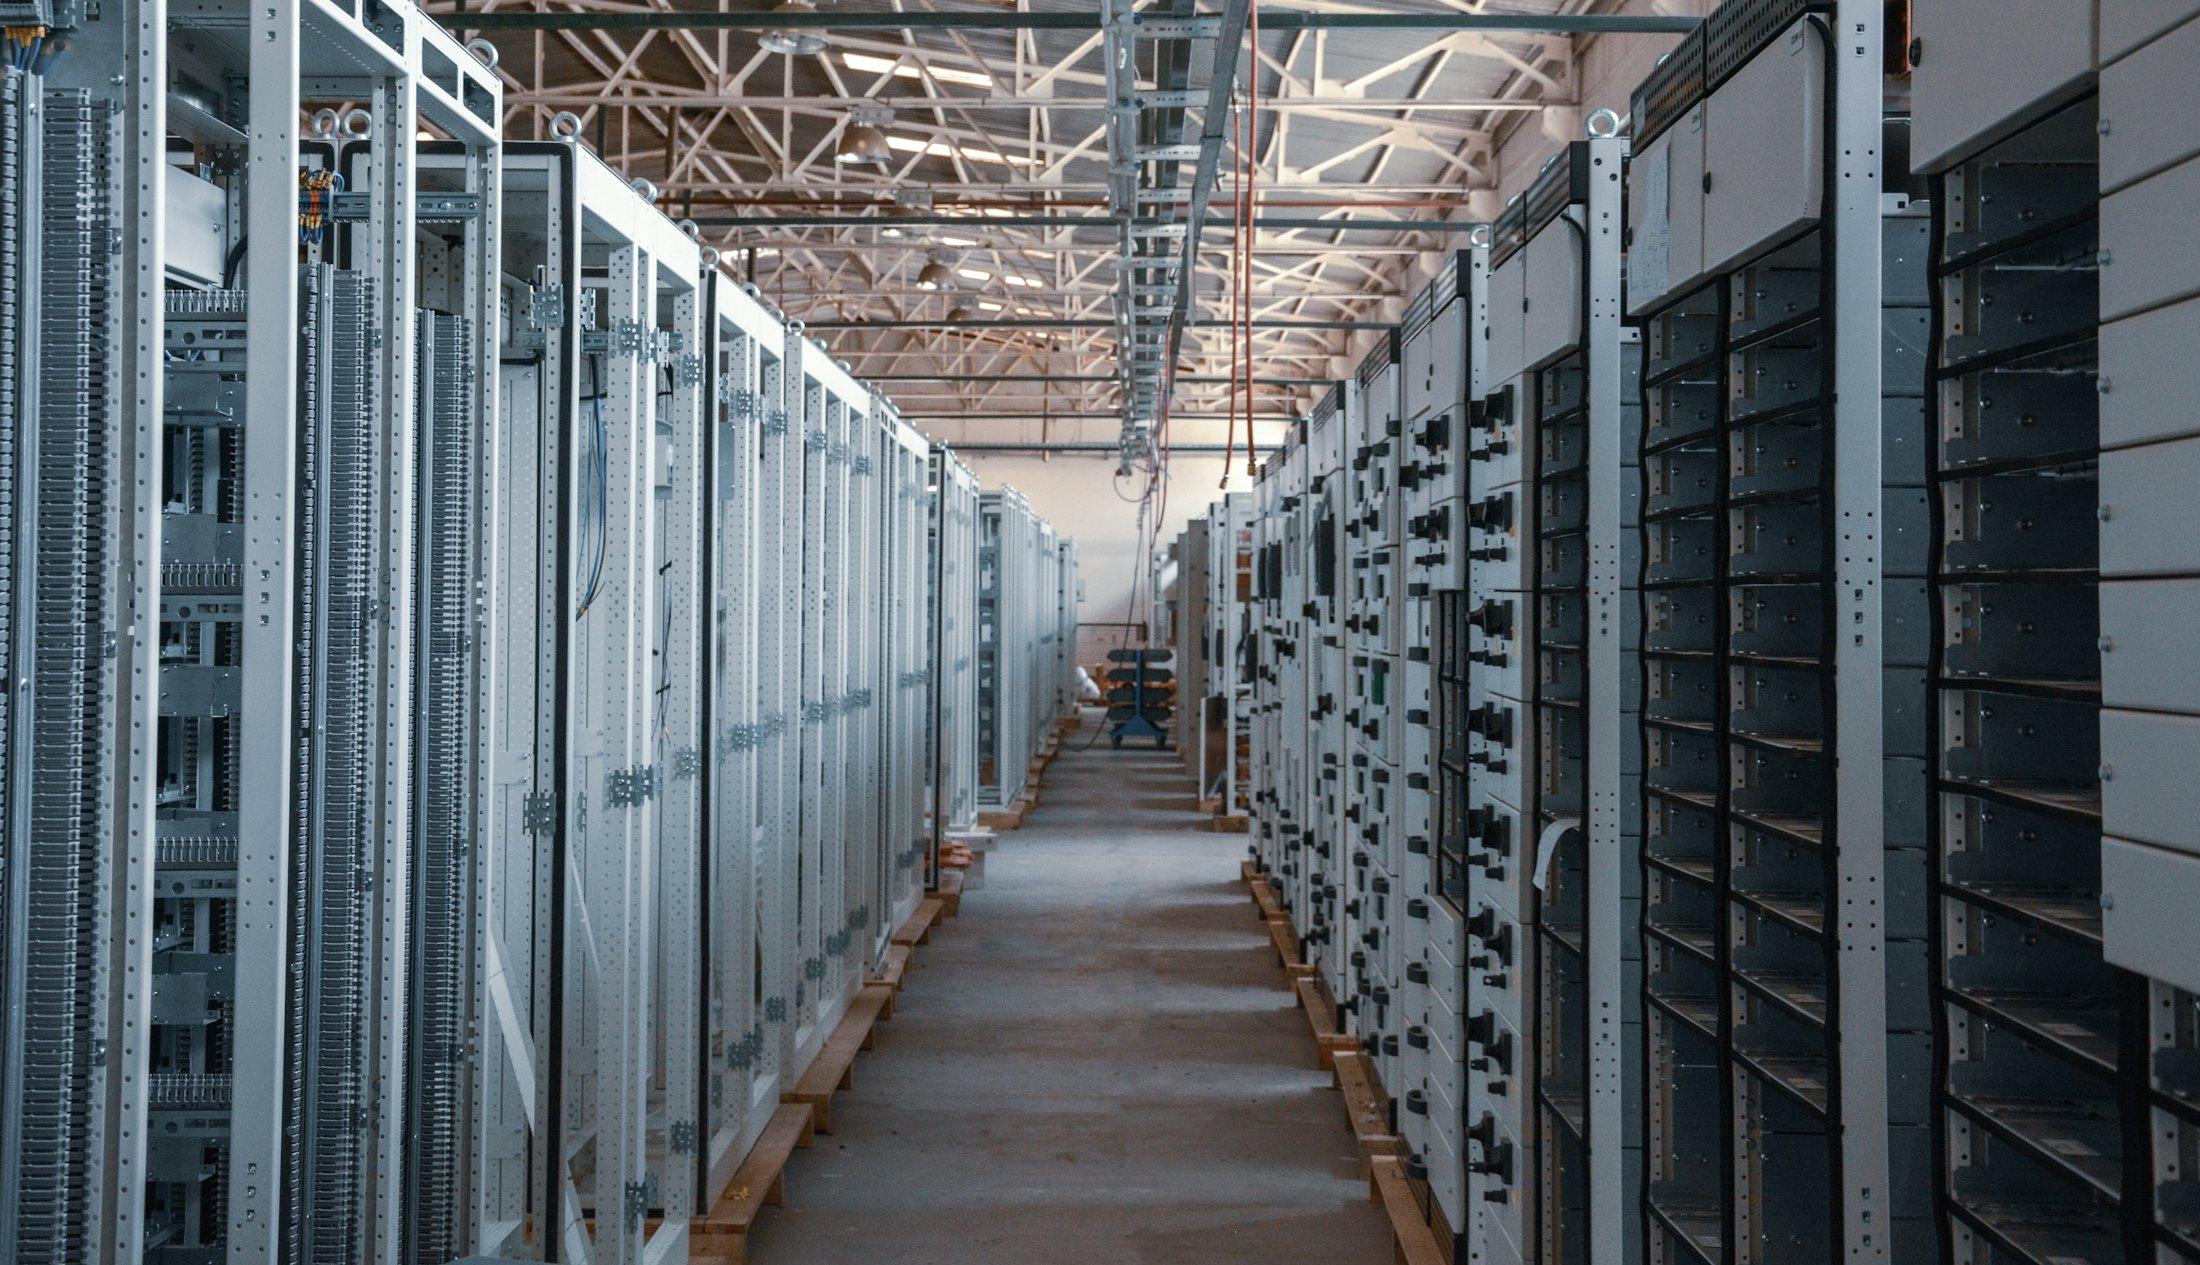
An aisle of server racks in a data centre.
01 · Technology & AI
A pipette filling a tray of sample tubes.
02 · Healthcare AI
A solar power plant seen from the air.
03 · Energy
02The sectors

Where we
concentrate.

Three sectors, chosen where we believe the next decade of earnings growth sits, each with its leaders listed in US dollars.

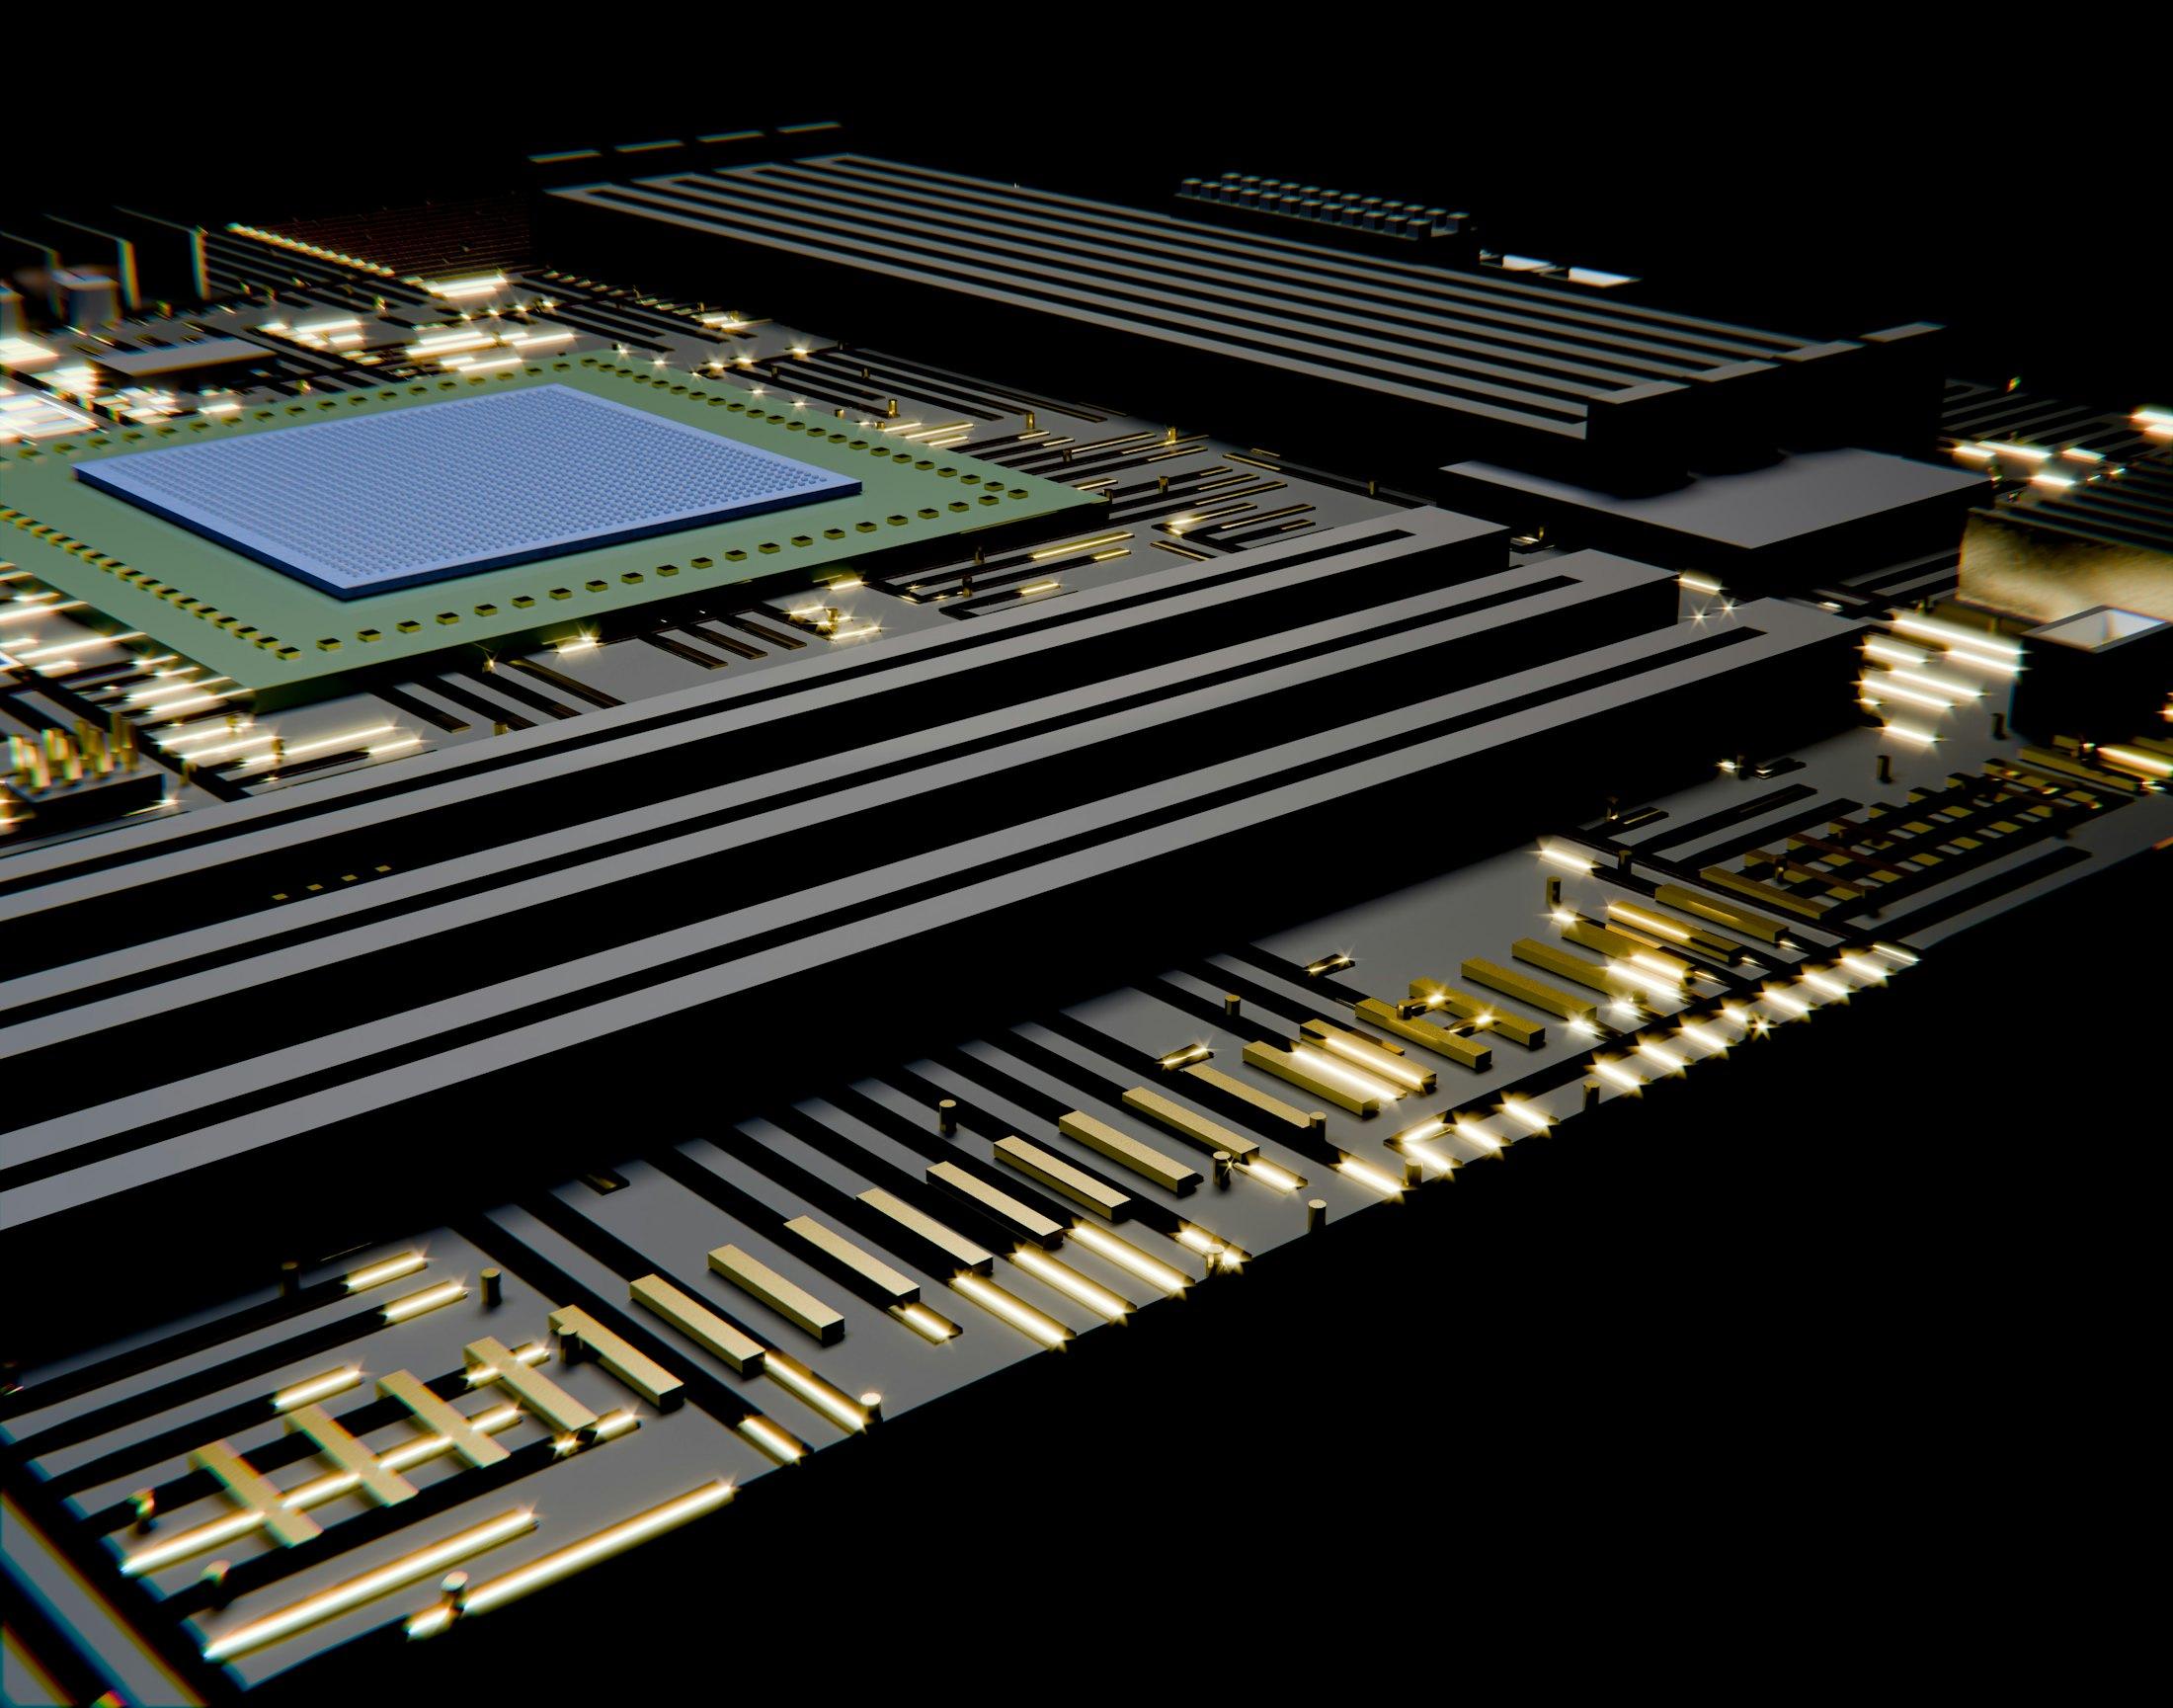
A processor seated on a dark circuit board.
01Core

Technology & AI

  • AI spending is the biggest driver of US earnings growth this decade. The largest cloud companies spend >$500B/yr
  • Chipmakers lead the cycle; software companies keep the margins
  • The leaders are listed in US dollars

Semiconductors · Cloud · AI infrastructure · Software

An aisle of server racks in a data centre.
A pipette filling a tray of sample tubes in a laboratory.
02Higher growth

Healthcare AI

  • Drug discovery, imaging and hospital workflow are being rebuilt around AI
  • Biotech deals reached >$100B in 2024
  • FDA approvals of AI tools are up 6× since 2020

Diagnostics · Precision medicine · Biotech · Workflow

A scientist adjusting a microscope.
Wind turbines silhouetted against a dusk sky.
03Cyclical

Renewables & Energy

  • Data-centre power demand rises +80% by 2030, on IEA figures
  • Renewables investment runs at >$2T/yr worldwide
  • Nuclear, LNG and oilfield services gain pricing power

Solar · Wind · EV batteries · Nuclear · Oilfield services

An aerial view of a large solar power plant.

Sector figures are third-party estimates cited for context, including company filings and the International Energy Agency; sources are available on request. They describe the sectors, not the fund or any holding. Forward-looking statements are expectations, not forecasts or guarantees.

03Why global

Two returns
in one.

For an Indian investor, a US share earns twice: on the market and on the dollar. Five years, in rupees:

  1. Nasdaq-100 vs Nifty 50Oct 2021 – Oct 2026 · in INR
  2. S&P 500 vs SensexOct 2021 – Oct 2026 · in INR
  3. Technology & AIDec 2020 – Oct 2026 · in INR
  4. HealthcareDec 2020 – Oct 2026 · in INR
  5. EnergyDec 2020 – Oct 2026 · in INR
United States, in INR India

Index comparisons cover October 2021 to October 2026 and are shown in INR: USD returns converted at period-end USD/INR, with October 2026 taken at ₹95. Sector comparisons are rebased to 100 at 31 December 2020 and run to 9 October 2026, also in INR. India: NSE Indices — Nifty IT, Nifty Pharma, Nifty Energy, price indices. US: Invesco QQQ Trust, VanEck Pharmaceutical ETF (PPH), Energy Select Sector SPDR (XLE), price closes, split-adjusted and excluding dividends, for like-for-like comparison with the Indian price indices. PPH is the closest construction match to Nifty Pharma; broader healthcare benchmarks XLV and IHE return +96% and +117% over the same period. Source: Yahoo Finance index closes and USD/INR, last close on or before 9 October each year. Past performance is not indicative of future results.